Ask a question; get an answer you can read, trust, and reuse — in whatever form fits.
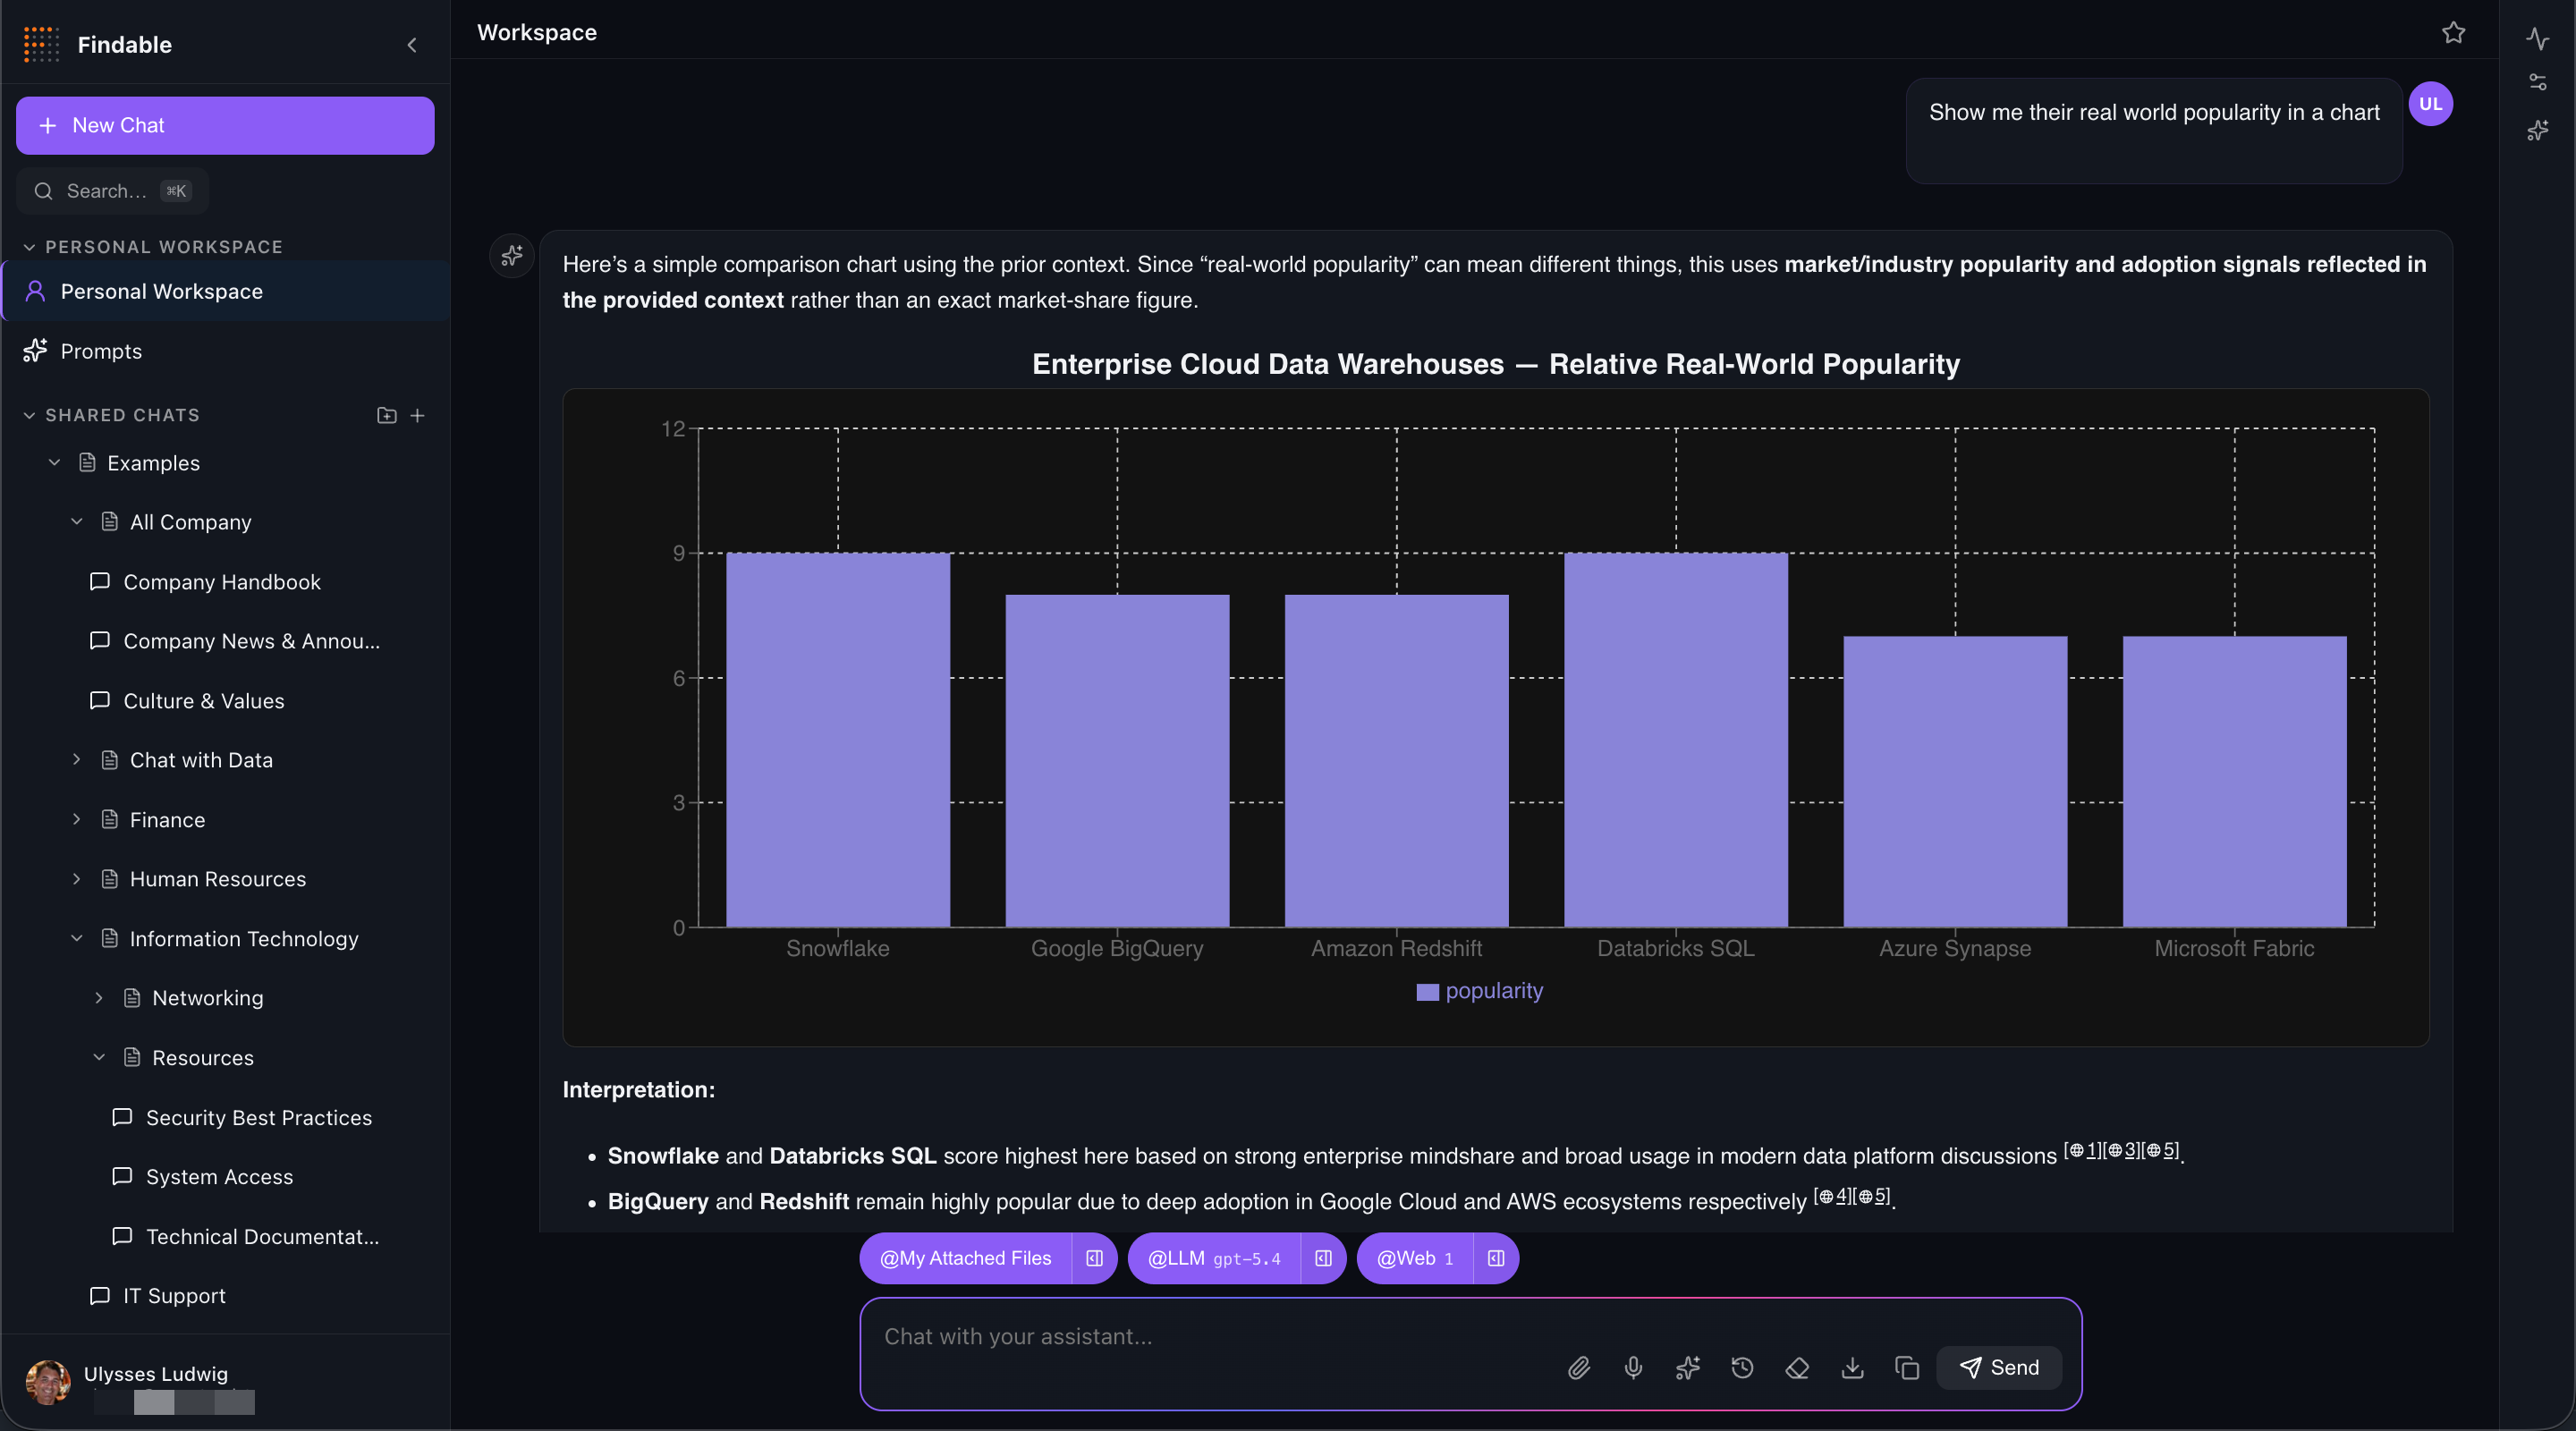
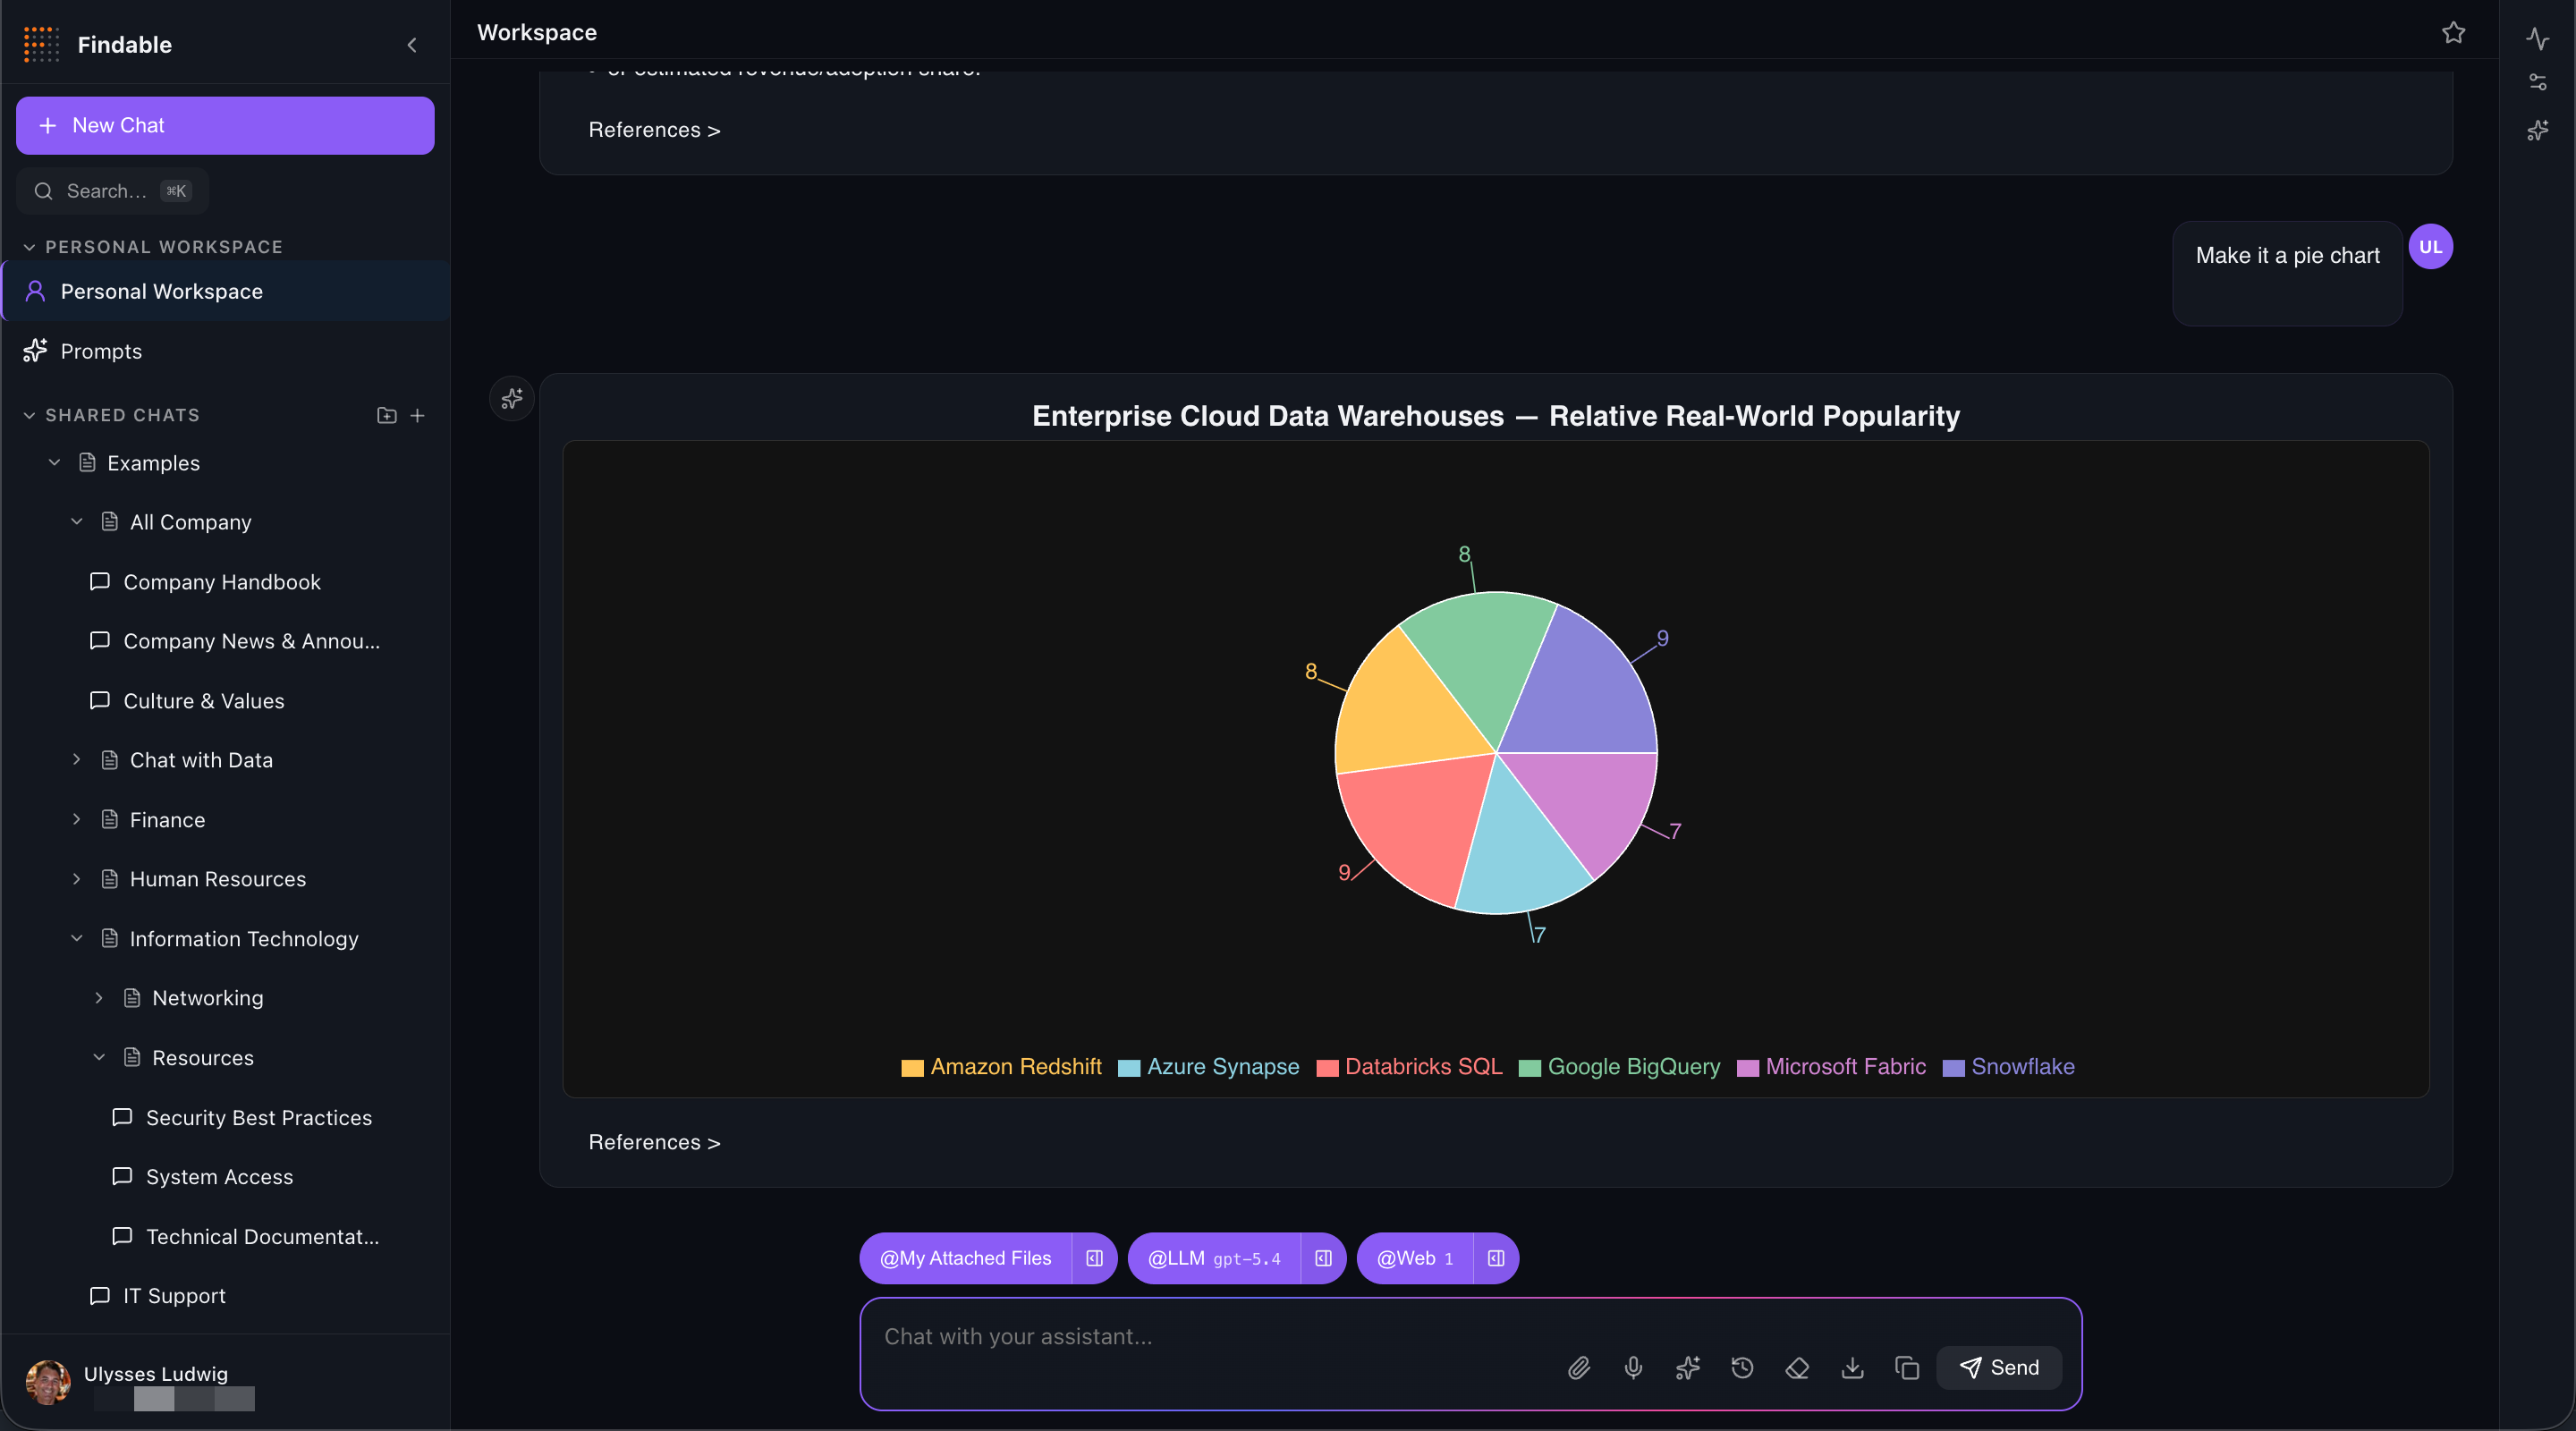
Interactive charts
When the answer is data, the canvas renders it as an interactive chart — bar, line, area, pie and more (Recharts). Hit Edit to change the chart type, series, or styling right in the thread.
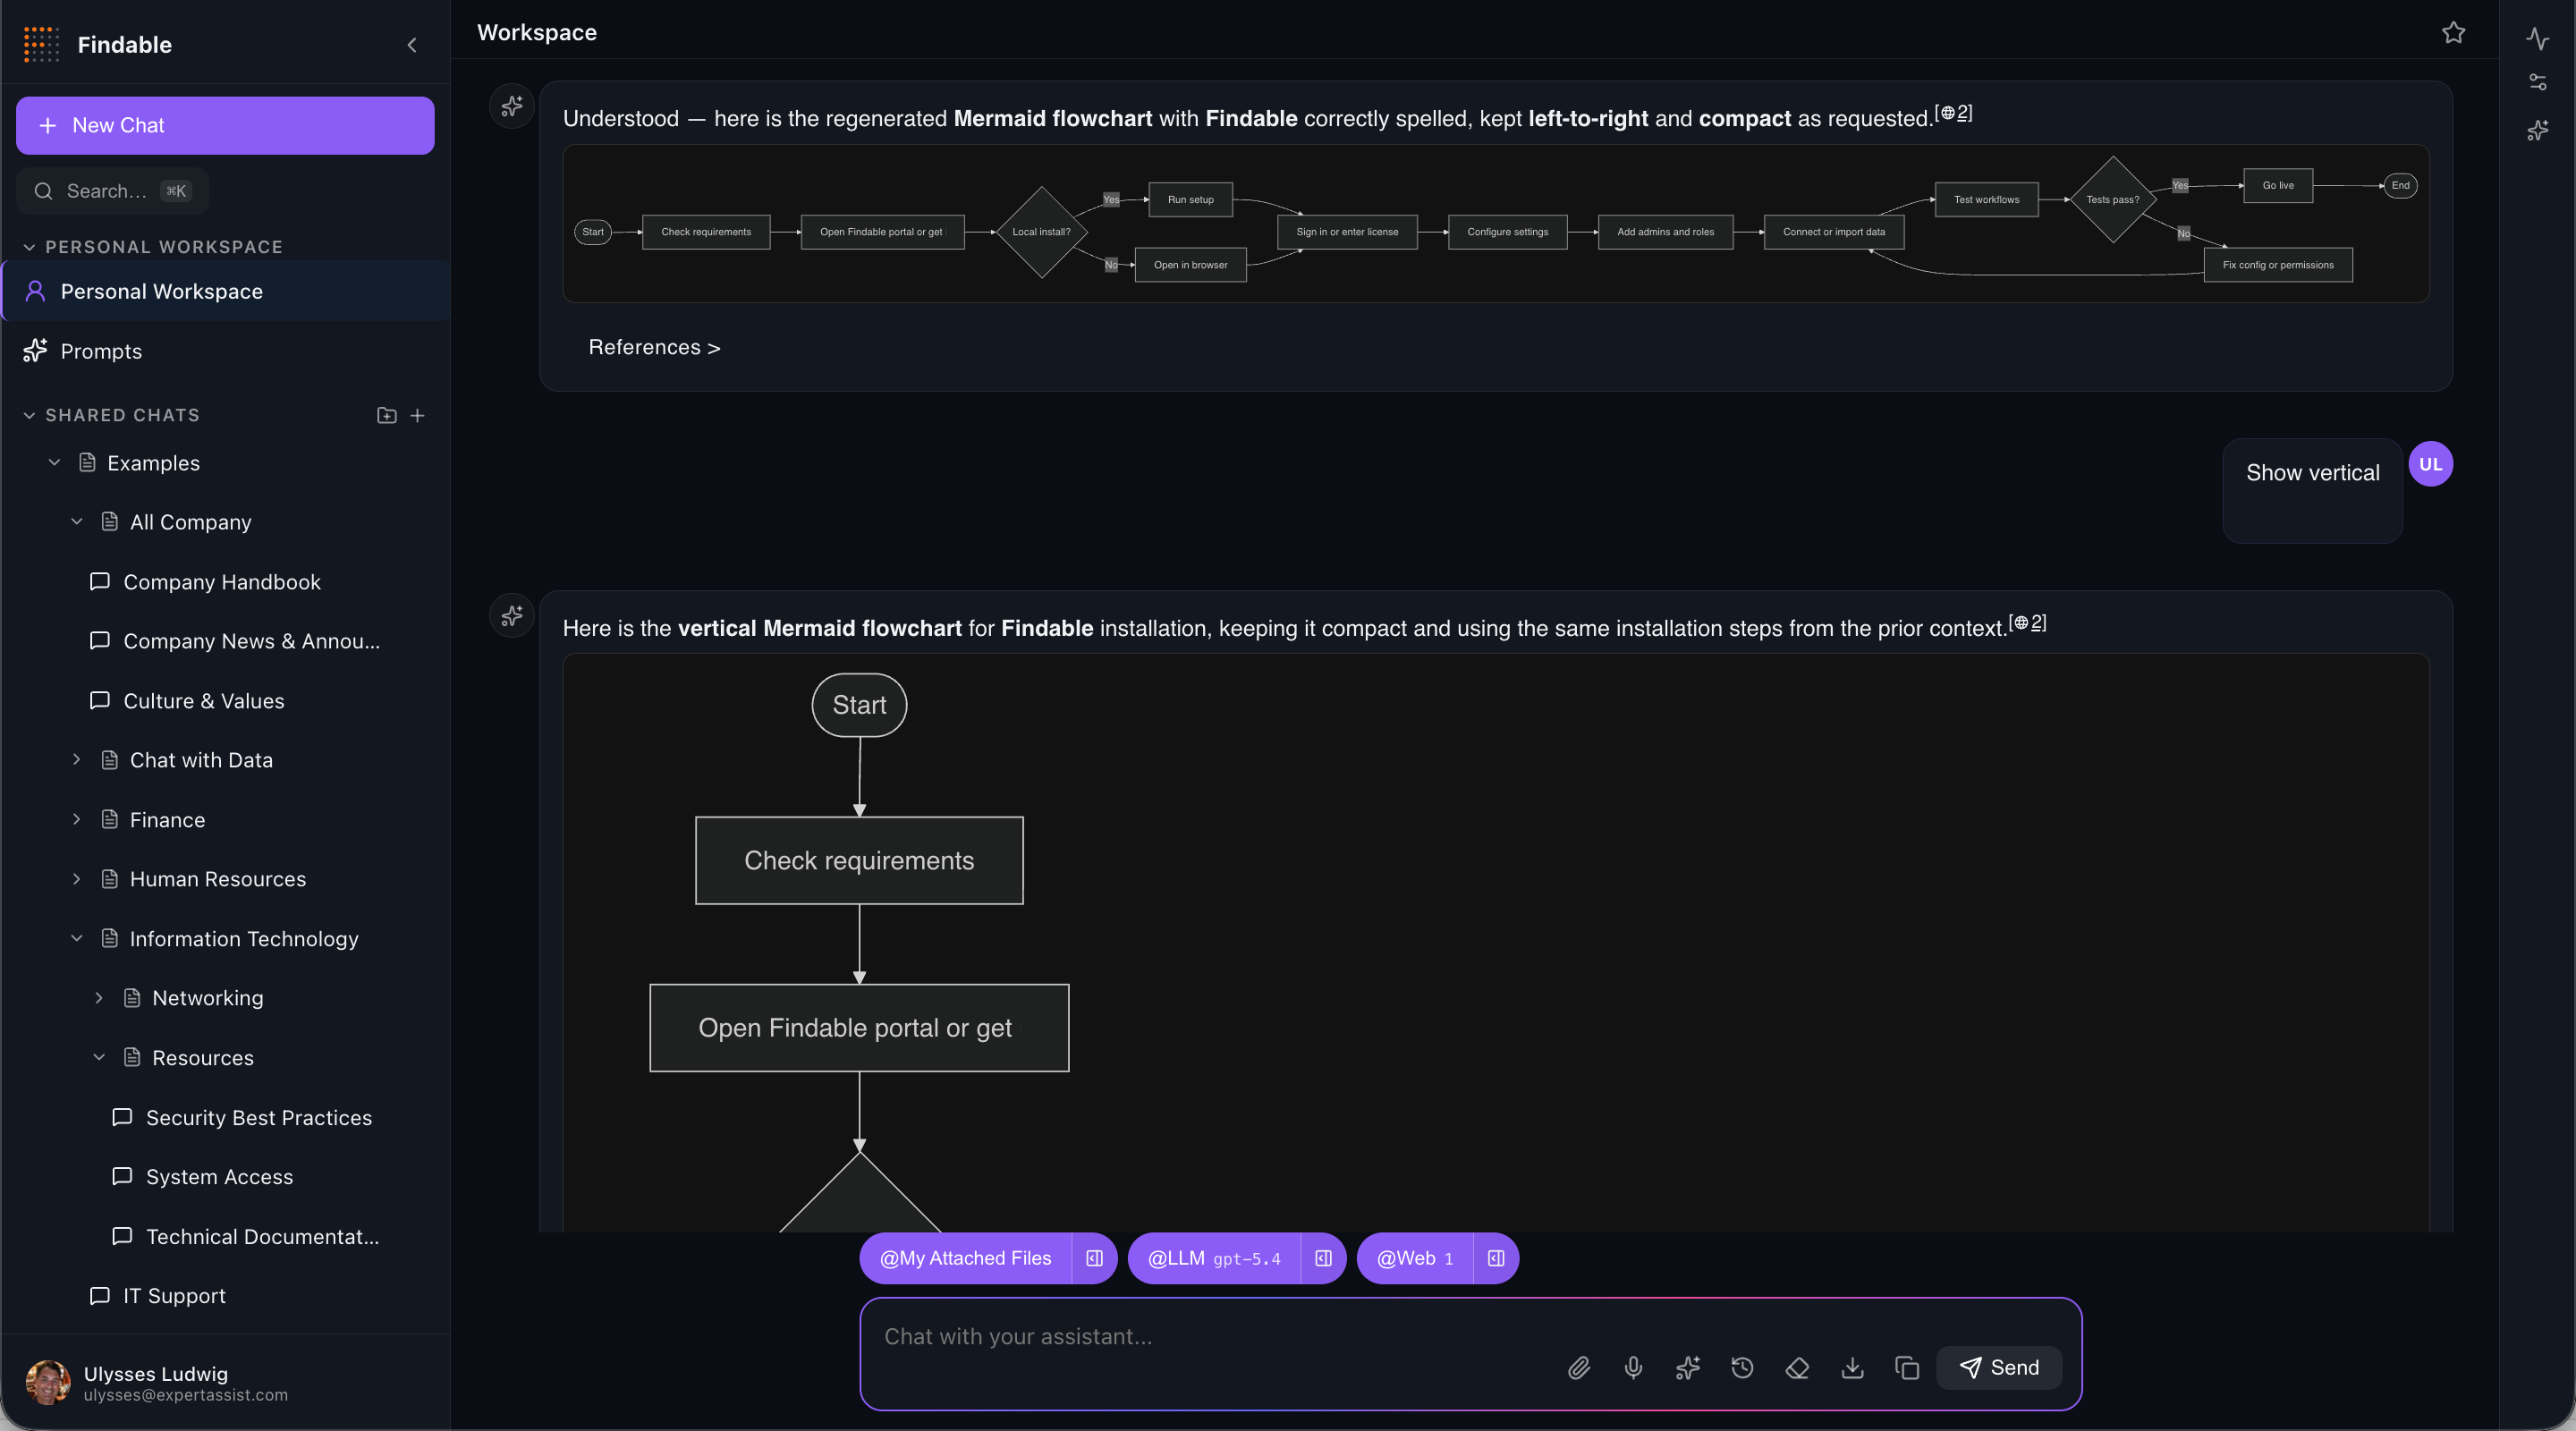
Editable diagrams
Flowcharts, sequence diagrams, ER diagrams, and mind maps render live via Mermaid. Open the inline editor to adjust the diagram and re-render instantly — no external tool, no screenshots.
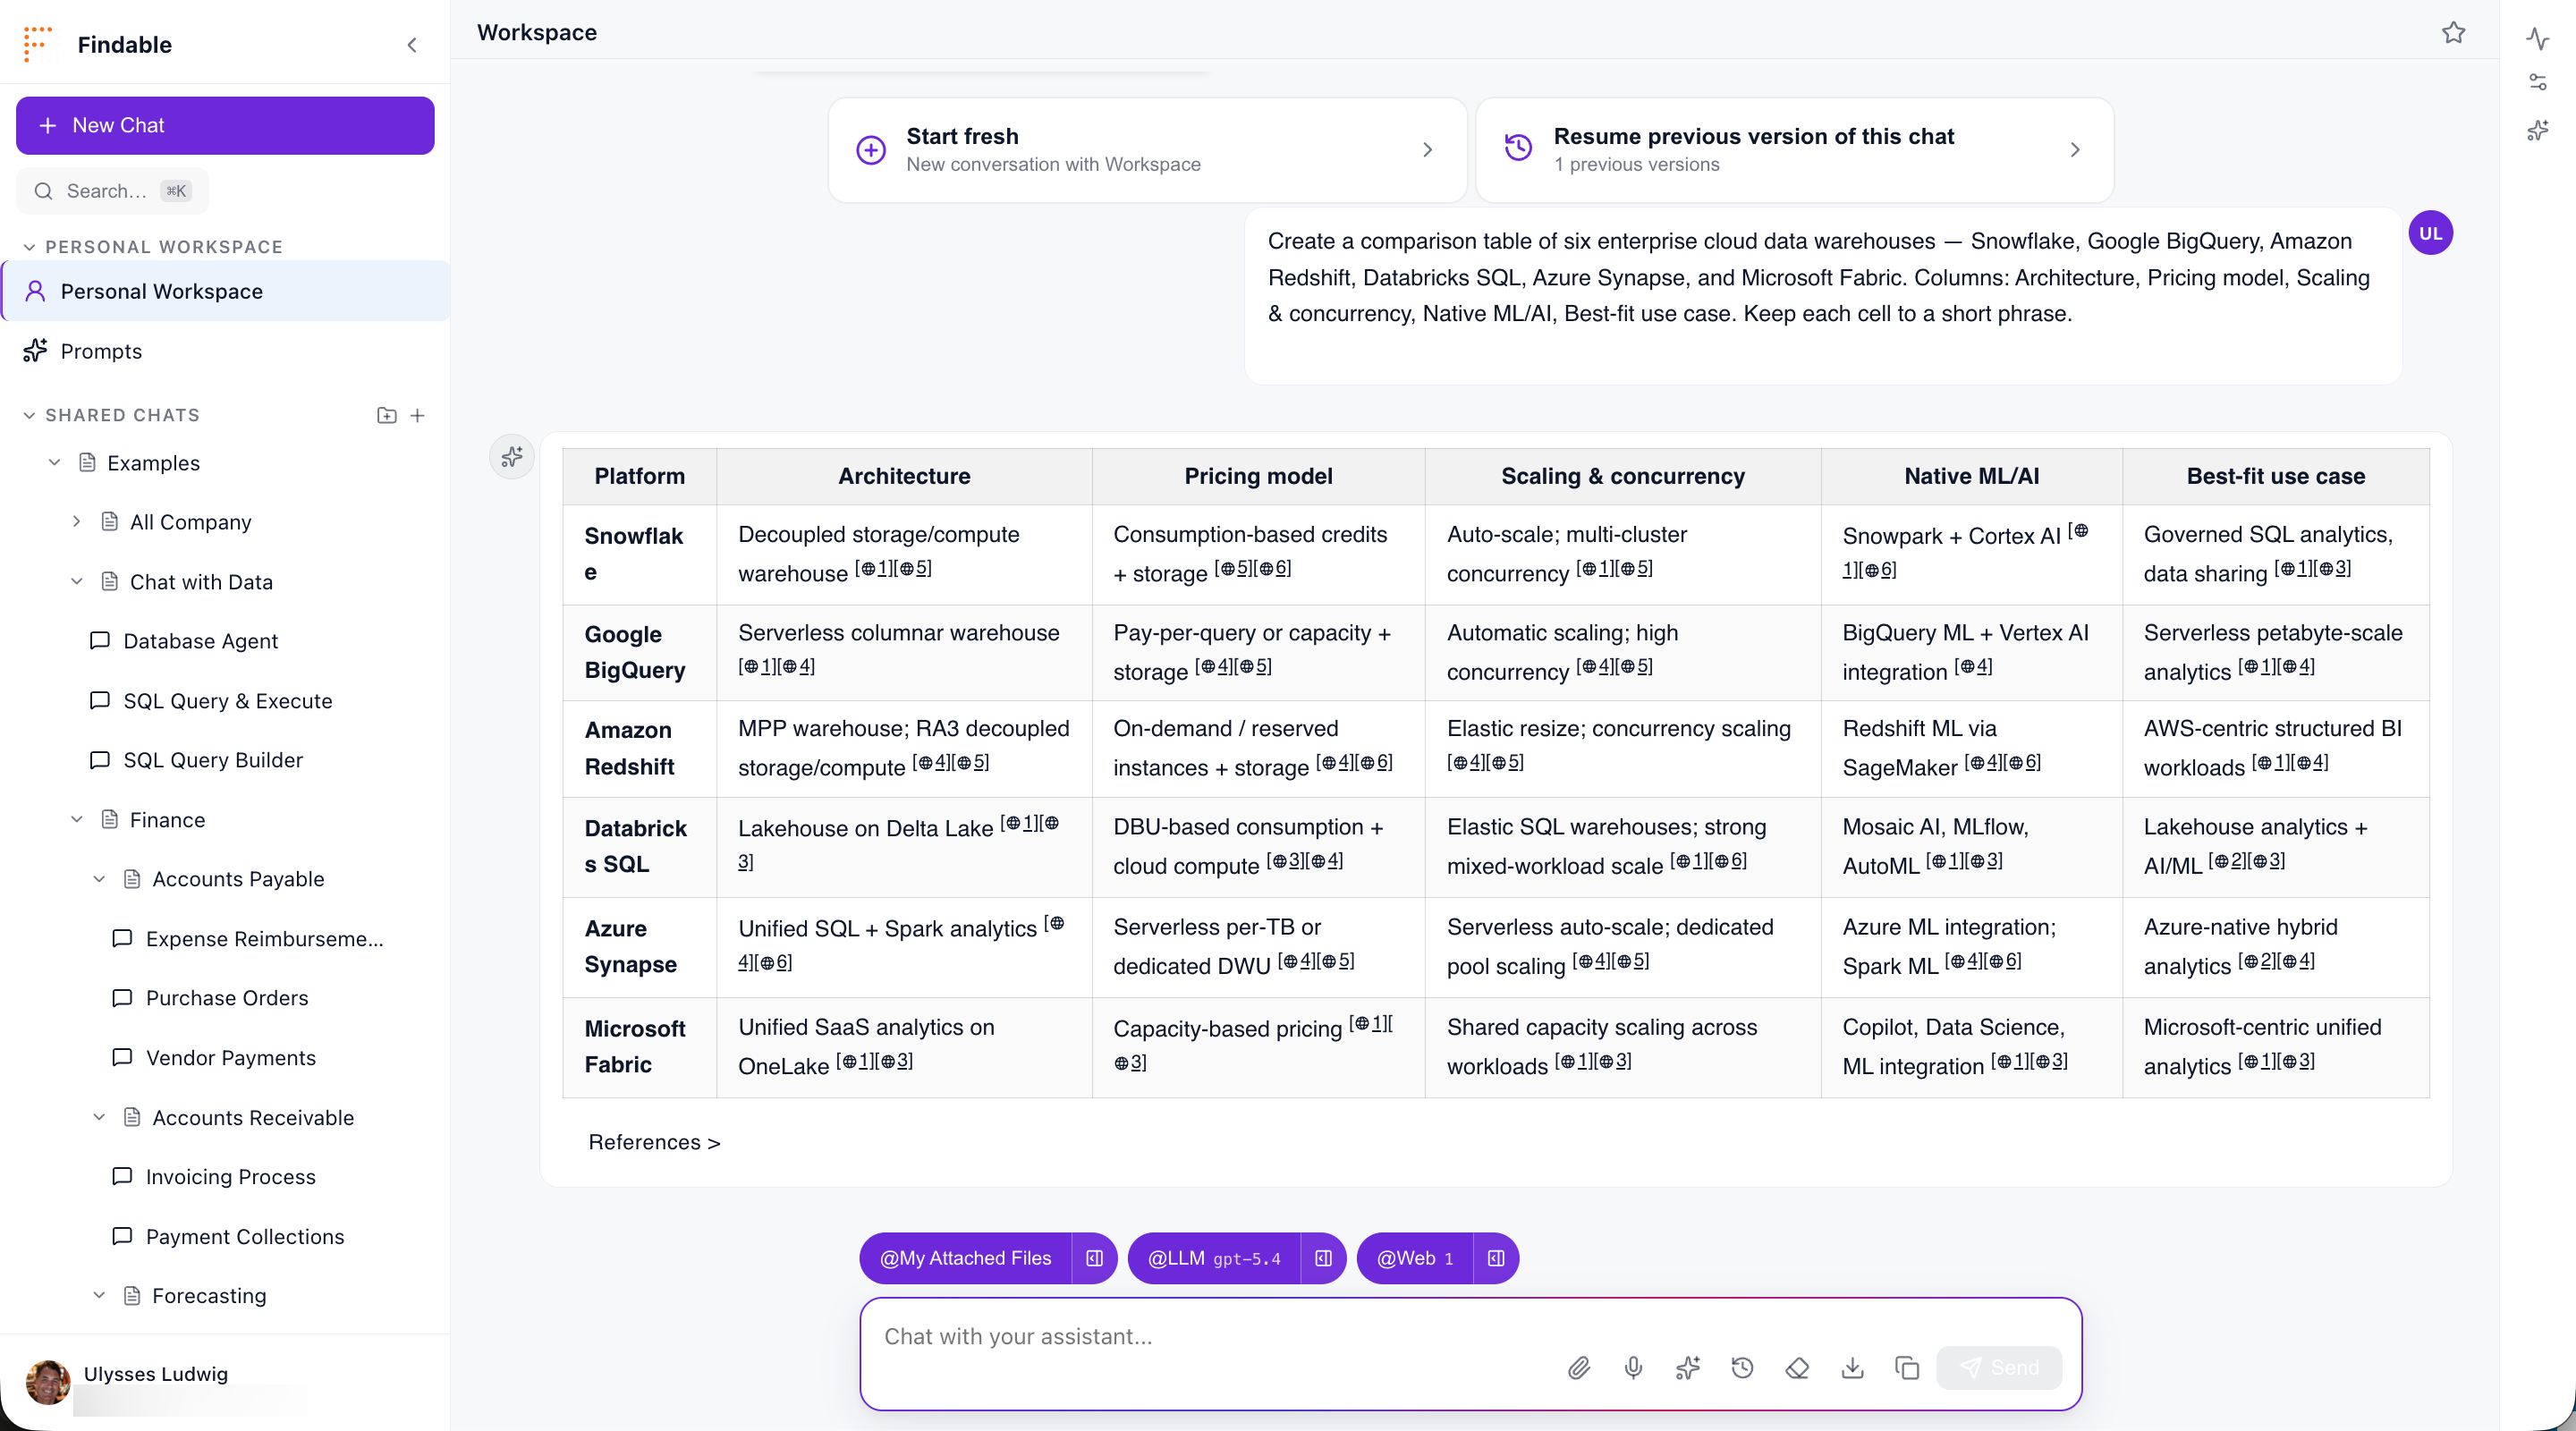
Formatted tables
Query results and structured data come back as clean, formatted tables (GitHub-flavored Markdown) — readable, copyable, and ready to paste straight into a doc or ticket.
Typeset math & formulas
Equations render as proper typeset math via KaTeX — from a simple ratio to full LaTeX — so quantitative and scientific answers are exact, not ASCII approximations. Formulas are editable too.
Syntax-highlighted code
Code returns in highlighted blocks with one-click copy, across every major language — so generated snippets are readable and ready to run.
Files & sources in view
A side panel keeps the files and data sources grounding the conversation visible — SharePoint, OneDrive, uploads, and connected data — so every answer traces back to where it came from.